A few months ago, my team and I were troubleshooting Zoom issues a top-of-the-line ASUS Republic of Gamers laptop. After a few minutes on a Zoom call, the system would begin to slow down. After an hour, while it was still connected to the call, it was almost impossible to control Zoom. Every click would lag. Moving the windows around was like watching a slide show.
It didn’t make any sense either. It was a top-end laptop with an Nvidia graphics card and plenty of CPU cores. Why would it be so slow? After all, we were only using regular Zoom, receiving video at 360p and sharing screen. It was a simple setup that even our most basic laptops could handle.
Why was this machine performing so awful?
Then, one of my technicians was able to replicate the issue on his laptop. This time, it was an ASUS TUF Gaming laptop. Plenty of cores, plenty of GPU power to go around for everything else. But Zoom was awful after about an hour of being used.
Is it the make and model of laptop?
Just a few weeks ago, we were producing a hybrid conference for a client. Three rooms, three computers. Each room was set up with both Zoom and Andre Savic’s awesome VideoCom Bridge for Zoom. We were mixing this feed into vMix, then streaming it all out to our online participants.
Two of the machines were just fine. But one of them was unhappy. With one remote participant and their screen share, the laptop was hitting 100% CPU usage. vMix was dropping frames. Zoom audio quality was horrid. But it too had an awesome Nvidia GPU and while only a 4-core machine, should have had enough power.
Why were all these machines struggling with Zoom?
After scratching my head for a while, I discovered what these three computers had in common.
They all had two GPUs.
One integrated into the processor for energy efficiency, and a dedicated GPU for high performance.
The issue was caused by Zoom rendering on one GPU, then being displayed on another.
That is an expensive operation on computers. Because each GPU can’t see what the other is working on, you have to copy frames from one GPU into system memory, then copy that data into the rendering GPU.
With Task Manager, we were able to diagnose this as the issue. But it was cumbersome.
In Task Manager on Windows, you can add columns to the Details view to see which GPU engine is being used by an application.
The Right Tools…
As I’ve mentioned before, one of my ongoing goals in the world is to help make troubleshooting video and voice-over-IP for event production a little easier. There’s already enough to go wrong on the human side. We want to make life easier for the technicians running the show.
That’s why I built tools like our NDI source browser tool and NDI Benchmarker apps.
For GPU troubleshooting, I wanted more details. While Task Manager, Process Explorer, and Performance Monitor are great tools, I wanted an at-a-glance way to see what applications were using which GPU.
Enter: Windows Management Interface (WMI) and DirectX Graphics Infrastructure (DXGI)
Under the hood, Windows collects a lot of data about itself. This data is accessible through the Windows Management Interface (WMI). I took particular interest in two queries: Win32_PerfFormattedData_GPUPerformanceCounters_GPUEngine and Win32_PerfFormattedData_PerfOS_Processor. If you want to explore these queries yourself, grab WMI Explorer and run them.
The first query gives you a breakdown of how each program on your computer is using your GPUs. As it turns out, it is possible for an application to use multiple GPUs at once. This query also provides in-depth details such as which GPU “engine” is being used (copy, 3D, VR…).
The second query lists out usage details for all the processor cores on your computer, along with a total. This includes details such as time spent processing kernel threads.
Kernel thread time is an important indicator of performance issues on Windows. In my past experiences, if the kernel time is high for a graphical program (say, vMix, Zoom, OBS), that suggests there are a lot of GPU-to-CPU memory copies going on. This is a huge burden on the system and can drag performance down to a crawl.
When this is combined with DXGI, I could now see which programs were using which GPUs, and what the utilization of each GPU engine was.
The Tractus GPU Usage Monitor
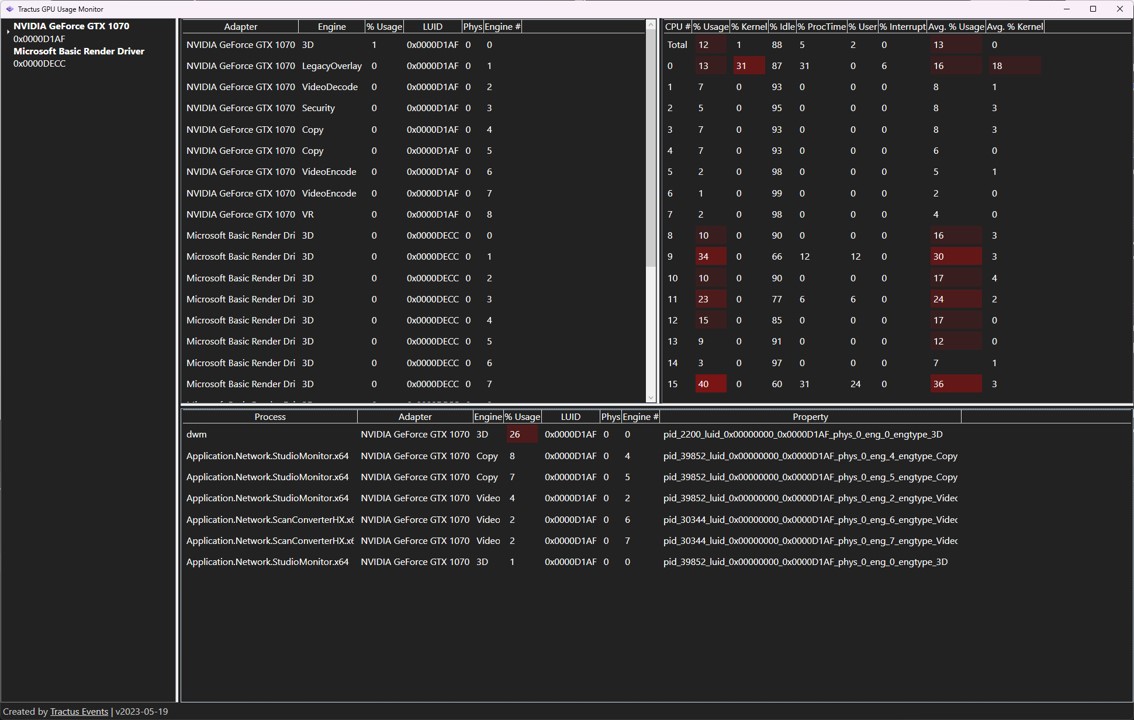
This application reports each second the following information:
- CPU usage by core, including time spent in kernel threads
- GPU utilization, broken down by engine type
- Program-level GPU utilization
Example Scenario
In our testing, we found that if you are bringing Zoom into vMix, and both vMix and Zoom are rendering on different GPUs, there will be a performance penalty. Elevated kernel thread times are a dead giveaway of this. Same with high GPU utilization of your energy-efficient GPU.
If you do run into this issue, check out our blog post on forcing Windows to use your high-performance GPUs.